|
|
|
#1
 10-27-2007, 12:20 PM
|
|||
|
|||
|
[ QUOTE ]
omg, and don't even get me started about 60% equity 40% bonds. that portfolio is 80% equity 20% bonds because in risk space (not even taking into acct correlations) equity risk dominates the portfolio [/ QUOTE ] barron, no one outside of the quant world talks about investments in risk space, and you're not going to get any converts, because weight space is a much more intuitive way to talk about portfolios, even if it does give misleading statements. -ed 
|
|
#2
10-27-2007, 12:59 PM
|
|||
|
|||
|
[ QUOTE ]
[ QUOTE ] omg, and don't even get me started about 60% equity 40% bonds. that portfolio is 80% equity 20% bonds because in risk space (not even taking into acct correlations) equity risk dominates the portfolio [/ QUOTE ] barron, no one outside of the quant world talks about investments in risk space, and you're not going to get any converts, because weight space is a much more intuitive way to talk about portfolios, even if it does give misleading statements. -ed [/ QUOTE ] i disagree to a point. risk space is fairly intuitive and gives a clear picture of what the portfolio looks like. here is a slide i just whipped together based off of the initial portfolio i described . it is ugly but gives an idea of why i think risk space can be intuitive. 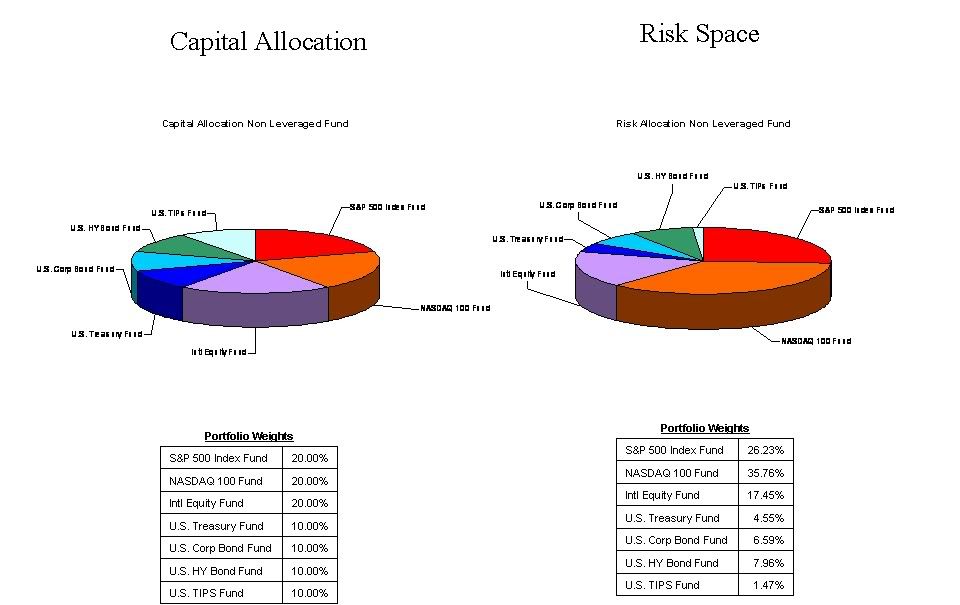 so you see, a 60% stock 40% bond allocation is really about 77% stocks and 23% bonds. the riskiness of stocks, and their high correlation with each otehr (i gave US stocks 80% correlation and int'l stocks 60% correlation) end up giving stock allocations more weight than less risky, lower correlated bonds (i.e. TIPS are about 25% correlated with US bonds over longer time horizons and high yield bonds are only about 60% correlated with govt bonds due to credit risk....but obv corporate bonds & HY bonds are bout 80% correlated in the example above) ignore the ugly colors and the non-prettyness of the slide [img]/images/graemlins/frown.gif[/img] maybe i'm naive but it seems that this would be a perfectly fine way to convey what the portfolio is exposed to. NOTE: the #s are calculated based of historic & logical assumptions of correlations & volatilities of the exposures listed. what do you think? thanks, Barron
|
 |
|
|


 Hybrid Mode
