|
#1
 10-31-2007, 12:03 AM
|
|||
|
|||
|
I know this has probably been discussed before, but it's 1st of Novermber tomorrow and the start of what is historically the strongest period for stocks:
 You can see most of the gains were made during the winter months, and the summer months only showed a very modest +EV but with similar volatility. For European markets, staying invested during the summer months is actually -EV while at the same time increasing your risk. A double dildo. There was a paper published several years ago about the Halloween effect that can be downloaded here. [ QUOTE ] Abstract: We document the existence of a strong seasonal effect in stock returns based on the popular market saying 'Sell in May and go away', also known as the 'Halloween indicator'. According to these words of market wisdom, stock market returns should be higher in the November-April period than those in the May-October period. Surprisingly, we find this inherited wisdom to be true in 36 of the 37 developed and emerging markets studied in our sample. The 'Sell in May' effect tends to be particularly strong in European countries and is robust over time. Sample evidence, for instance, shows that in the UK the effect has been noticeable since 1694. While we have examined a number of possible explanations, none of these appears to convincingly explain the puzzle. [/ QUOTE ] Here are a few charts from the paper: 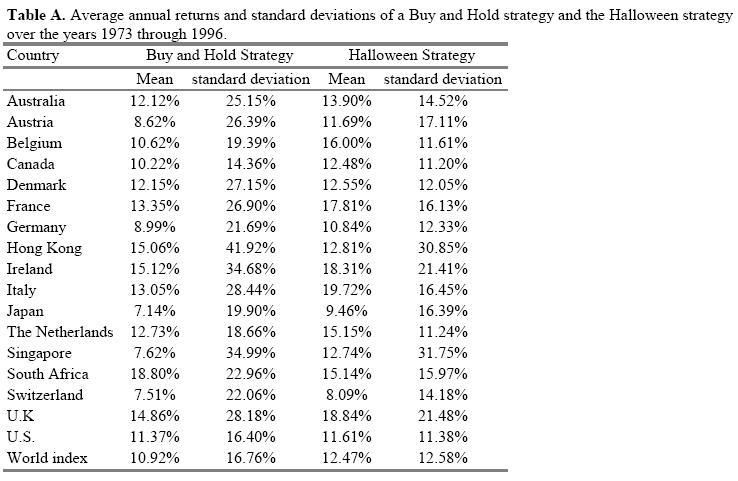 Stdev would obviously be less if you're only invested for half the year, but the outperformance is very significant. 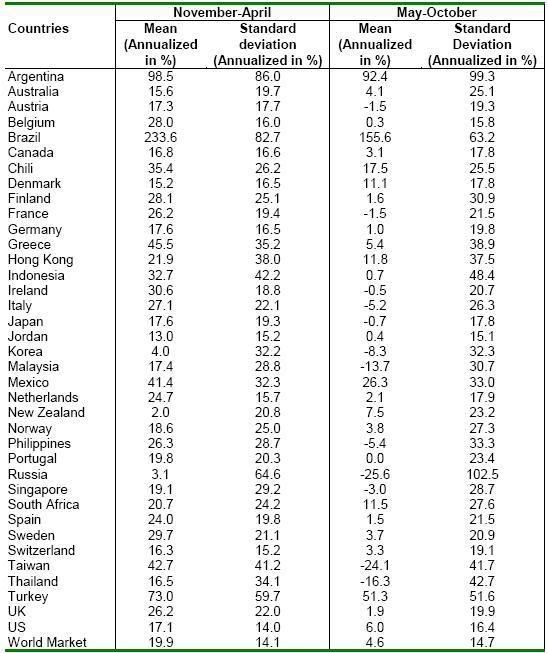 Stripping away the outsized returns from some emerging markets would reduce the summer returns to probably a negative value. All 37 markets in the above table returned a +ve value for the winter months, whereas 12 of them lost value on average during the summer. ALL markets except New Zealand's performed better during the winter than the summer and almost 75% of them did it with a lower standard deviation. These results seem compelling but there's no logical explanation. I've tested this strategy on UK stocks after the 1996 data above and the relationship continues. I think it is largely due to some sudden drops during the summer period (911, .com burst) although outperformance continues even when discounting the worst performing years of the summer months. This strategy would obviously have tax implications for many (esp. US?) investors, but many investors in other countries (eg. UK) can switch funds tax-free and commission-free between equity index trackers and cash/bonds. 
|
|
|


 Threaded Mode