|
|
|
#1
 11-28-2007, 06:38 PM
|
|||
|
|||
|
Interesting read on Simons that was on berg the other day. Here's just a few parts of it.
By Richard Teitelbaum Nov. 27 (Bloomberg) -- On a hot afternoon in September, Renaissance Technologies LLC founder Jim Simons is too busy to take a phone call. It is, he says, from Cumrun Vafa, a preeminent Harvard University professor and expert on string theory, which describes the building blocks of the universe as extended one-dimensional filaments. ``Get another time when I can talk to him,'' Simons tells his assistant. Then he mentions that the next day, he'll be meeting with Thomas Insel, director of the National Institute of Mental Health, to discuss autism research. And he's slated that Saturday to host a gala honoring Math for America, or MFA, a four-year-old nonprofit he started that provides stipends to New York City math teachers. ``I'm undoubtedly involved in too many things at the same time,'' Simons says in his 35th-floor office in midtown Manhattan. ``But you make your life interesting.'' String theory, autism, math education: It's fair to ask how Simons, 69, manages his day job overseeing the world's biggest hedge fund firm. The answer, judging from the numbers, is very well. Renaissance is on fire: Its Medallion Fund -- which uses computers and trading algorithms to invest in world markets -- returned more than 50 percent in the first three quarters of 2007. It had about $6 billion in assets as of July 1. Simons registered that performance as subprime and related markets were collapsing, sending two mortgage-related hedge funds run by Bear Stearns Cos. into bankruptcy. The turmoil pummeled the Goldman Sachs Global Alpha Fund, a rival to Renaissance's funds, which fell more than 25 percent during the same time. Morgan Stanley's computer jockeys lost $390 million in a single day in early August. Doubling Assets Along with routine personnel and marketing tasks, Simons takes time for the researchers and programmers who stop by his office to discuss mathematical and statistical issues they've encountered as they work on new trading strategies. More than 200 employees, of whom about a third have Ph.D.s, work in East Setauket. Another 100 are based in Manhattan, San Francisco, London and Milan. ``He creates an environment where it's easy to be creative and works hard to keep the [censored] level to a minimum,'' says former managing director Robert Frey, who worked at Renaissance from 1992 to 2004. Even without the new commodities fund, Renaissance's assets have more than doubled in a year from about $16 billion on Sept. 30, 2006. That growth has catapulted Renaissance past such titans as Daniel Och's Och-Ziff Capital Management Group LLC, Ray Dalio's Bridgewater Associates Inc. and David Shaw's D.E. Shaw & Co. to become the world's largest hedge fund manager, according to data compiled by Hedge Fund Research Inc. and Bloomberg. Leaving Academia In 1977, frustrated with a math problem and eager for change, he abandoned academia to start what would become Renaissance, hiring professors, code breakers and statistically minded scientists and engineers who'd worked in astrophysics, language recognition theory and computer programming. ``All the quants in the world are trying to follow in Jim's footsteps because what he's built at Renaissance is truly extraordinary,'' says Andrew Lo, director of the Massachusetts Institute of Technology Laboratory for Financial Engineering and chief scientific officer of quant hedge fund firm AlphaSimplexGroup LLC. ``I and many others look up to him as a tremendous role model.'' The tendency for fund managers to try to emulate Simons may become more curse than blessing in the years ahead. As the selloffs in July and August showed, many quant funds are chasing the same investments. For example, as of June, Renaissance and rival AQR Capital Management LLC had four of the same top 10 stock holdings: Johnson & Johnson, Lockheed Martin Corp., International Business Machines Corp. and Chevron Corp. Wise-Cracking Renaissance is under increasing pressure to stay ahead of the pack -- and to keep its secrets under wraps. Save current employees and a few former ones, nobody knows precisely how the firm makes its millions. Medallion stopped taking new money from outside investors in 1993 and returned pretty much the last of their capital 12 years later. Today, the fund is run almost exclusively for the benefit of Renaissance staff. The wise-cracking Simons himself is mum on virtually all of its details. What can he say about Medallion's trading strategy? ``Not much,'' Simons says with a chortle, and then takes a drag on one of the Merit cigarettes he often smokes. What kind of instruments does it trade? ``Everything.'' How many different strategies does it use? ``A lot.'' Simons says his Ph.D.s laugh when they read the far-fetched theories about what their fund might be doing. One chat room participant speculated that Renaissance uses audio hookups to futures exchanges and analyzes the noise from the pits with voice-recognition software. 
|
|
#2
11-28-2007, 06:46 PM
|
|||
|
|||
|
I just read that before I saw this post. Since this is 2+2, also:
"At MIT, Simons worked hard and played hard -- mostly late- night poker." and link: http://www.bloomberg.com/apps/news?p...efer=exclusive
|
|
#3
11-28-2007, 07:21 PM
|
|||
|
|||
|
[ QUOTE ]
I just read that before I saw this post. Since this is 2+2, also: "At MIT, Simons worked hard and played hard -- mostly late- night poker." and link: http://www.bloomberg.com/apps/news?p...efer=exclusive [/ QUOTE ] Damn, that was one long article. I guess you could say he's the Chris "Jesus" Ferguson of Hedge Funds.
|
|
#4
11-29-2007, 12:39 AM
|
|||
|
|||
|
[ QUOTE ]
I just read that before I saw this post. Since this is 2+2, also: "At MIT, Simons worked hard and played hard -- mostly late- night poker." and link: http://www.bloomberg.com/apps/news?p...efer=exclusive [/ QUOTE ] I don't think they're quite on the same level.
|
|
#5
11-28-2007, 09:43 PM
|
|||
|
|||
|
[ QUOTE ]
...but there is NO magic bullet foolproof sytstem that will conquer the markets.....period. [/ QUOTE ] I mentioned this is my OP. Everybody starts off thinking thsy have some magic key. I have discovered myself over the years that there's no magic key. The only wizardry (imo) would be mastering your own behaviour as you make discretionary trades. [ QUOTE ] This is what makes the best traders in the world what they are...they have the talent/discipline/split second ability making qualities needed to be flexible in their decisions,and not being tied into a numbers specific system or program.Their money management disciplines are uncanny as well [/ QUOTE ] I agree too. Ed Seykota (paraphrased): [ QUOTE ] There are 3 golden rules for trading 1. Always follow the rules 2. Always follow the rules 3. Know when to break the rules [/ QUOTE ] A good trader knows when to follow his rules and when to change or modify the rules. A machanical system eventually degrades, but only an expert knows when this is simply an expected drawdown, or the system has lost its edge. Richard Dennis and his crew did fantastically in the 1980s trading a simple trend-following method. But markets do change (from a trader's perpective) and this model no longer is practically tradeable - although it still has an edge as I've tested it recently. There just aren't the susutained trends available in today's markets. Also: (I think) William Eckhardt said: [ QUOTE ] You have to know when to really step on the gas [/ QUOTE ] In refering to money management. Opportunity factors may limit the number of high-probablility trades you can make, forcing you to take lower EV trades while waiting. When all your ducks are in a row, a good trader knows when to increase their bet-size and thus improve their edge and expectancy. I developed a system with a very high profitability. It's losers were both smaller in number and value than winners - and I've never seen another system like it. The problem was, it would only be in the market about 0.5% of the time - ie. one quick trade per year per market, I would have had to scan 1000s markets every night looking for that trade. The opportunity factor wasn't there to make the system worthwhile. It would be these trades when a good trader would increase their position sizes. Since I am not a good trader, I was unable to trade this system. I think many successful systems traders have these subtle discretionary elements in them. After all, if these human inputs were not needed, then the greatest math and computer brains would have developed a system happily chugging on autopilot vacuuming up the world's money while they slept.
|
|
#6
11-29-2007, 09:39 AM
|
|||
|
|||
|
Many traders dont have a plan. A plan should be a set of rules to guide each trade. Writing down what you intend to do and how you will react to each situation. A plan helps to remove pesky emotions from trades and helps you become somewhat detached from the market on an emotional level. A plan should remove panic and indecision since we have predetermined responses which have been tested, are logical, understandable concepts, and are known to work.
I suggest we try and trade a simple concept. I dont have the knowledge or expertise to start looking for arbs or deep statistical relationships to exploit. Simple concepts work well and tend to be more robust. Ive spent years trying to re-invent the wheel doing this in the past I am currently studying some well-known statistically relevant relationships in various markets. There are lots of apparently good relationships, but its difficult to formulate a tradable plan around them, and I suspect Im still busy trying to re-invent the wheel here .. The first simple concept I think is whether we are going to buy high or buy low (and sell high or sell low). My first system buys high and sells higher (I cant short this one for tax reasons) which is opposite to what people intuitively try to do. This is essentially a trend-following system which follows the strongest uptrends in 25 stock markets/sectors, 10 bond markets and 1 moneymarket. It holds a maximum of 5 positions at any one time and makes approximately 2 round-trip trades per year, and holds positions for usually a few months or years. Another system I use is a mixture between swing and trend trading. I look for value in 7 long-term stock index uptrends (and v-v) and hold the position for as long as I can until the trend reverses. This holds positions for weeks or months. It has worked wonders on Asian markets but bombed in US markets. Both the above are relatively difficult to trade psychologically because of the poor win-rate (~30% for #1) and heavy drawdowns accompanied by many consecutive losses, (12 in a row stings) and watching and waiting as yet another tidy winner turns around into a loser. I propose we develop a shorter-term modification of the latter system. Look for value in uptrends and sell rallies in downtrends nothing new here. The main difference (aside from the timeframe) from system #2 will be profit targets. Ive never liked profit targets as it is often the profit from one wild runaway trade that makes up for all the little losers and accounts for more than your years profit. Limiting profits by using a target may or may not make sense. It will, however increase the systems win-rate at the expense of perhaps reduced expectancy (possibly negative), and despite the reduction in profit expectancy, may make the system easier to follow and thus more likely to be stuck to during nasty drawdowns. It will involve selling longs in a runaway uptrend, but avoid holding positions during failed breakouts which gap back or holding on to winners as they retrace back to somewhere near our initial stop you cant have it all. Ill dig out some charts to better illustrate this concept but its really simple. Then we can try and look for an edge together, or at least a way to trade the concept. Its difficult to define or quantify an edge without proper testing and much experience. If the concept makes logical sense then we can move onto the next step. Obviously, I hope others can make suggestions/flameless criticisms along the way and maybe propose superior ideas before I start digging too much into anything.
|
|
#7
11-29-2007, 08:44 PM
|
|||
|
|||
|
Ive found a stock (RGU) which looks to have some nice swings. Notice that this would be refered to as a "penny stock" in the US. It's currenctly trading around 80 pence. Penny stocks are sometimes avoided for various reasons in the US, but the price of a stock isn't really so relevant outside the US. Blue chips can be priced below a pound.
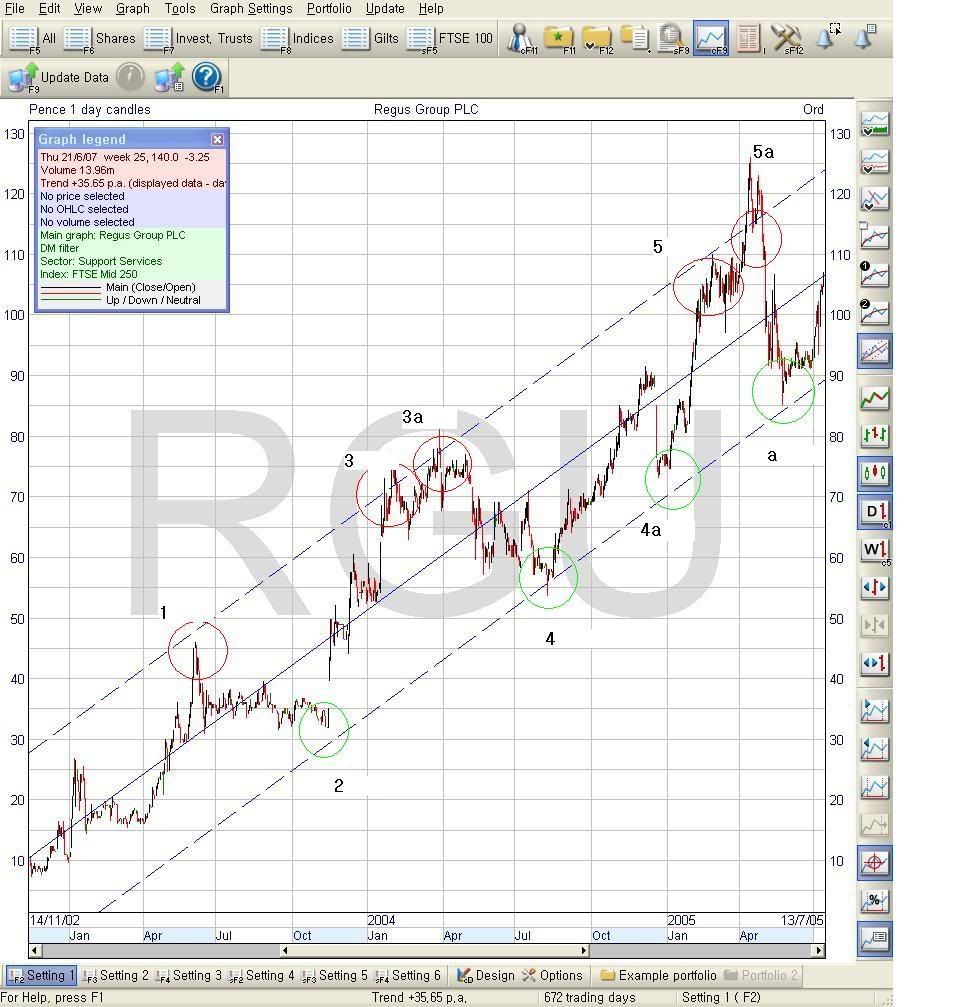 There was a nice uptrend beginning after the tech meltdown and lasting until Q2 2005 when it entered quite a wide trading range until the recent summer volatility during which is has tanked. This is a weekly chart using a daily scale, but markets are fractal allowing me to illustrate a basic concept. Ive drawn a basic trend line with channels either side 2 std devs away each side from the main trend. This is easy to do in the middle of the chart, but Ill look for effective ways to quantify (or at least qualify) the trend and the channel when thinking about set-ups making it less ambiguous at the right edge of the chart. Ive drawn green circles around oversold (value) areas of the uptrend and red circle around overbought areas. The old adage the trend is your friend can be illustrated with this market trend. Assuming 2 trades in either direction: Long: 2 3 (35p to 70p) = 35p move 4a 5 (75p to 105p) = 30p move TOTAL 65p Short: 1 2 (45p to 35p) = 10p move 3a 4 (75p to 55p) = 20p move TOTAL 30p So trading with the trend gives more than double the potential rewards here. Obviously only a fraction of each swing can be caught and perhaps most trades will lose money, but the basic concept remains valid. This means I will be filtering out shorting signals during uptrends and long signals during downtrends. Another basic fundamental but very important concept. This stock appears to be following an Elliot Wave pattern during this uptrend. 1-2-3a-4-5a followed by the first retrace of the down-leg (a). The final leg (4a - 5a on this chart) being the most tradable move - but Im not going to concern myself with market cycles at this point. This next chart zooms in to the upleg 2 3 on the above chart. 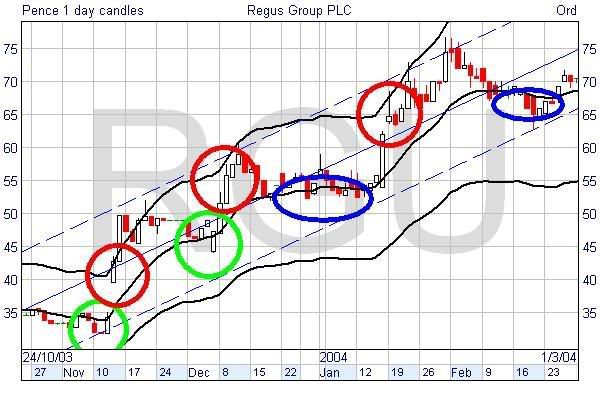 Again there is the solid blue line representing the underlying trend with blue dashed confidence lines 2 standard deviations away easy to draw in hindsight. This time Ive overlaid a black 13-bar exponential moving average (EMA13). This EMA is enveloped by a channel drawn by shifting this EMA 20% in either direction. This isnt a Bollinger Band as we are not yet concerned with volatility, but this EMA envelope can be modified later so that volatility data is used in its construction. Notice how wide this envelope is. The distance between the top and the bottom of the envelope represents approximately 40% of the value of the market, yet it contains around 90-95% of the markets prices. An equity indexs envelope by comparison, might only be as wide as 4-5% of the market. A market with a wide trading envelope represent a bigger target from which we can extract profits with less room for error and a lesser impact from trading costs. We can better see a similar patter being played out on a smaller scale. 3 legs up with 2 retraces in between. I havent labeled these #1-#5 as the chart is already a little cluttered. The green circles again show areas of value in an uptrend and the red circles show areas where the market might be temporarily overbought. The blue ovals show brief areas of potential consolidation which might lead to whipsaws and getting stopped out of losing trades. We can look for ways to limit these losses and potentially eliminate them to some degree through the use of filters can be discussed further in the set-ups sub-thread. I think we need to be looking for entries in the green areas (below the EMA in an uptrend), looking for exits in the red areas (below the upper envelope in an uptrend) and looking for ways to preserve our capital in the blue areas (when the short-term trend become undefined). Please make any suggestions that come to mind.
|
|
#8
11-30-2007, 12:15 AM
|
|||
|
|||
|
kimchi,
I am watching this with some interest. You might want to set some parameters that limit your scope, focus your attention and simplify the universe of options. For example, you might decide to go with 1. Long equities no margin; 2. Selecting only stocks with 1B or more marketcap, selling for more than $10 and avg volume of at least 500K shares a day. This criteria eliminates shorting, options and thinly traded stocks. I do believe that a trader must get experience beating long-stock without margin before getting fancy. I know this from first-hand experience. You appear to have done considerable homework. You seem to have an good grasp on many important trading concepts. Given my impression of your study in trading, I am surprised to see that you are apparently thinking about zeroing in on one equity instrument. Using such an instrument exposes you to the temptation of over-optimizing your system parameters, potentially leading to all sorts of trading tragedies. Truly robust systems work well using a very narrow range of 'optimal' parameters tested against a great many instruments. Such systems allow you to screen for potential longs that exhibit a sought-for chart pattern or price-action state. The instruments that come through the screen often provide the dividend of helping to identify promising sectors that are on the way up. For example using a screen for specific chart states often reveals several issues in the same sector that exhibit that state. The book New Trading Systems and Methods 4rd edition by Perry Kaufman is an excellent resource for more information on this and many other essential system construction concepts. Book:Trading Systems and Methods
|
|
#9
11-30-2007, 02:25 AM
|
|||
|
|||
|
[ QUOTE ]
Aside: I never understood the idea of "forward testing". It is just the slowest possible way to do backtesting: later. eastbay [/ QUOTE ] I meant more about splitting data into chunks and doing separate test on each. Yeah, I wouldn't use forward testing for strategy testing so much. I think forward testing is more useful to see how you get along with actually using your system day to day. For example, I spent some time backtesting some ideas on The US markets only to discover during forward testing that my broker didn't allow the movement of guaranteed stops outside of market hours. And US market hours didn't fit into my normal daily routine. Or maybe searching, screening, filtering, datamining and entering/adjusting orders is proven to take too much time. [ QUOTE ] You appear to have done considerable homework. You seem to have an good grasp on many important trading concepts. Given my impression of your study in trading, I am surprised to see that you are apparently thinking about zeroing in on one equity instrument. [/ QUOTE ] I'm not thinking about trading a single market, and certainly not necessarily RGU. It's just that RGU exhibits some of the qualities that I feel might suit this type of trading. I think we can discuss markets and trading vehicles more later in a 'markets' sub-thread. Hopefully, the forum will suggest a basket of (perhaps lowly/non correlated) markets to try and trade after we've made a list of criteria needed to be condidered before a market is included in the system. [ QUOTE ] Truly robust systems work well using a very narrow range of 'optimal' parameters tested against a great many instruments [/ QUOTE ] I intend to do some testing using the same parameters across different markets which will include some stress conditions (ie - 10/1987, bond/debt crises, 9-11, etc) [ QUOTE ] The book New Trading Systems and Methods 4rd edition by Perry Kaufman is an excellent resource for more information on this and many other essential system construction concepts. [/ QUOTE ] Thanks for the suggestion. I have a few of Kaufman's books on my bloated Amazon wishlist but I've only read some articles and such, and never a book. I have tried to incorporate his adaptive moving average into some systems without successs. I suppose I should just read more about his ideas in his books. I think his adaptive MA is one of those fantastically simple ideas which I've been unable to implement. I actually spent a long frustrating, fruitless time trying to develop my own AMA before I realised it had already been done before - Doh!
|
|
#10
11-30-2007, 09:46 AM
|
|||
|
|||
|
Heres another chart. This time a forex pair (GBP/CAD) showing a transition from a long term uptrend to downtrend earlier this year.
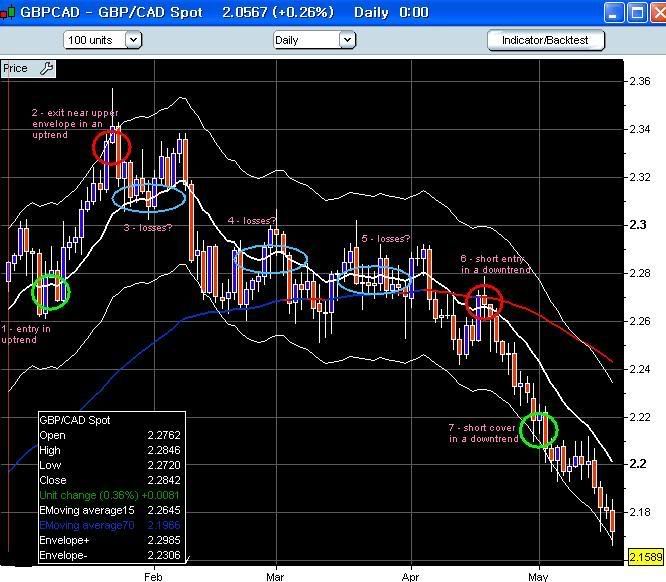 This time Ive overlaid a longer EMA (70) to illustrate the medium-term trend, which might help us to trade in the direction of least resistance. Its blue during uptrends (when the previous bars EMA value is below the most recent value) and red in downtrends. I have the same EMA15 with an envelope, but this time an envelope shift of 1.5% away from the EMA15 is enough to enclose most of the recent prices. Compare this with the 20% shift needed for the volatile mid/small cap stock (RGU) discusses in my previous post. So again, we have 2 good potential trades. Point 1 to 2 shows a similar entry/exit area as before, but then there was a change of trend which prevented us from looking for longs as the trend was down, according to the EMA70. Area 6 7 shows a good potential trade from the short side.. Notice how we would have covered our short just inside the lower envelope (around 2.26 to 2.22 a decent profit) preventing us from following the downtrend to around 2.08 a huge move lost. We may have had other opportunities to enter the trade, but this illustrates a psychologically difficult part of trading. Watching as some big fish get away is tough, but if that isnt part of your objectives or part of your trade plan, then you must be satisfied with just making a correct trade. Save following trends for another system. Points 3,4, and 5 are the tricky areas. They would probably have made us enter positions destined to be losers as they were in the middle of a transitioning trend as EMA 70 changed from up to down trending. This creates nasty, but often unavoidable, whipsaws. These losses can be limited though careful use of stops, exits, and/or applying some filters. This is a good example of the importance of getting your stops and exits right. Filters remove some opportunities to trade but hopefully leave the cream of the set-ups to trade. These can be discussed later, but a quick look at the chart suggests a few possible filters. For example, if the entire bar is below the short term trend (EMA15) during an uptrend (blueEMA70), then stand aside and vice-versa. Or another one The long-term trend needs to be a certain strength before a trade is taken. There are ways to objectively quantify the trend strength. These ideas can be discussed later but illustrate the 3 market states; up, down, sideways, and hopefully the 3 trade positions you will match to the market state; long, short, stand aside. Trying to incorporate these concepts into a simple system is difficult.
|
 |
|
|


 Hybrid Mode
