|
#31
 07-10-2007, 03:50 PM
|
|||
|
|||
|
[ QUOTE ]
refinery ratios, which have a fundamental basis, are 5 barrels of crude = 3 barrels of gas + 2 barrels of heating oil. you can put on 1-1 crack spreads, although i think these are more speculative than anything. [/ QUOTE ] ah, i got it now. all that margin would make a dent. i dont know notionals/tick size for RBOT or Natural Gas but crude is 1k/point. margin is probably around 20% right? if so the amt is pretty significant. Barron 
|
|
#32
07-10-2007, 05:02 PM
|
|||
|
|||
|
Another trade today:
US 10yr yield is now just above 5.02%. likely causes are 1) economist's survey reveals they feel new growth will not cause inflation so no rate hikes in the future (capacity hasn't fallen, so future demand must be expected to fall). in that vien, home depot & others have talked their forcasts down. 2) subprime downgrade possible for just over 12bil in securities by S&P. may cause demand for safe debt. 3) related to 1, possible slower growth & lower earnings and feeling that subprime mortgage market may still indeed spill over to consumer demand which has remained robust throughout. i think there are some good reasons for the rally, but i feel it overshot and the yield we are seeing now is too low relative to current economic conditions imo. so i'm back to being more strongly short the us10yr. maybe a signal of around -50 to -60% Barron
|
|
#33
07-18-2007, 11:25 AM
|
|||
|
|||
|
[ QUOTE ]
Another trade today: US 10yr yield is now just above 5.02%. likely causes are 1) economist's survey reveals they feel new growth will not cause inflation so no rate hikes in the future (capacity hasn't fallen, so future demand must be expected to fall). in that vien, home depot & others have talked their forcasts down. 2) subprime downgrade possible for just over 12bil in securities by S&P. may cause demand for safe debt. 3) related to 1, possible slower growth & lower earnings and feeling that subprime mortgage market may still indeed spill over to consumer demand which has remained robust throughout. i think there are some good reasons for the rally, but i feel it overshot and the yield we are seeing now is too low relative to current economic conditions imo. so i'm back to being more strongly short the us10yr. maybe a signal of around -50 to -60% Barron [/ QUOTE ] i think it's time to stress this again as at this moment (11:09am July 18th), bond yields are trading at 5.018%. inflation data is still pushing the upper boundry coming in at 2.2% core reading yoy and with June readings at and above expectations at .2% for headline and .2% for core respectively. yes, crude oil is high which may depress consumption and bring out some slack in capacity. but there is an offset there too, high crude oil creates large surpluses in oil exporting countries. those surpluses find their way back to the US govt bond markets since a whopping 2/3s of other country savings are in US bonds. so net net, the effect of higher crude on bond prices may be anywhere from slightly positive (pushing yields down) to even: either way, not a big upside for bonds as many seem to think could be the case. despite this, the economy has been very strong and is likely to continue to stay as such keeping capacity at or above its level of 81and change %. anything higher (i.e. leading indicators coming in tomorrow at more positive than the consensus -0.1% and/or jobless claims coming in below the 310k consensus) and we'll likely start to see more upward pressure on inflation. we'll get some more data next week as advanced GDP and durable goods orders come in. i think these are likely to show strength and come in at or above expectations. there is a risk in that the "spillover" fear is still imminent if consumption comes in as a result of reduced buying power of subprime homeowners. at best though, this will simply delay a rate rise rather than spark a rate cut (still a slight likelihood priced into the fed funds options markets). capacity is too high, growth too strong, and inflation too close to uncomfortable levels for yields of 5.018% to be justified imo. Barron
|
|
#34
07-19-2007, 04:40 PM
|
|||
|
|||
|
[ QUOTE ]
Quoted from your gold falling article - ``You're going to make more money in agriculture than in gold,'' Jim Rogers, chairman of Beeland Interests Inc., said yesterday in an interview. ``I would worry about gold.'' Iowa farmland is the clear play here. [/ QUOTE ] Exactly right!!! Information on this subject can be found in my IOWA FARMLAND thread in this financial forum at 2+2. Ethanol is the main reason behind this.
|
|
#35
07-19-2007, 10:10 PM
|
|||
|
|||
|
Sheesh now what does Mr. Now do? Mr. Now cannot decide.
Bet initiated at: 64.22 Current price: Last Trade: 67.01 Trade Time: 4:15PM ET Change: Up 0.39 (0.59%) Prev Close: 66.62 Chart: http://stockcharts.com/h-sc/ui?s=gld Mr. Now is very lucky. For now....right?
|
|
#36
07-19-2007, 10:13 PM
|
|||
|
|||
|
From Marketocracy, starting with 1MM:
NOW-L * Name: MrNow's LONGS * Net Asset Value (NAV): $14.34 * Compliant: No * This past week + Return: 3.19% + Did you beat the: o S&P 500 (return of 1.44%): YES o NASDAQ (return of 1.52%): YES o Dow Jones (return of 2.17%): YES * Trailing 30 days + Return: 8.27% + Did you beat the: o S&P 500 (return of 2.43%): YES o NASDAQ (return of 4.83%): YES o Dow Jones (return of 3.15%): YES Mr. Now is very lucky. Right?
|
|
#37
07-19-2007, 10:25 PM
|
|||
|
|||
|
Mr. Now respects DcfrThs and values his posts.
Mr. Now wonders out loud if DcfrThs might be willing to do some detailed intermarket analysis on gold, gold shares, the indexes (SP, Dow), the dollar and the long bond. Wednesday of this week is certainly an interesting day for serious students of intermarket analysis.
|
|
#38
07-20-2007, 12:20 AM
|
|||
|
|||
|
[ QUOTE ]
Mr. Now respects DcfrThs and values his posts. Mr. Now wonders out loud if DcfrThs might be willing to do some detailed intermarket analysis on gold, gold shares, the indexes (SP, Dow), the dollar and the long bond. Wednesday of this week is certainly an interesting day for serious students of intermarket analysis. [/ QUOTE ] :SDFJK:WJKEOPJIPOJFL:WKEJC mother F*CKER. i just spent 1 hr responding to this post and forgot about the time and got a "form no longer valid" error... i can usually hit the back button and get the text back but NOT THIS TIME. F*CK. grrrrrrrrrrrrrrrrrrrrrrrrrrrrrrrrrrrrrrrrrrrrrrrrr rrrr. pissed, Barron i might have to rewrite the response tomorrow but i'm too pissed right now. EDIT2: F*CK still steaming when i think of the work i put into this response, jesus...i even made pretty excel charts (weren't included in my response though) on money supply and evertying F*CK.
|
|
#39
07-20-2007, 12:41 PM
|
|||
|
|||
|
[ QUOTE ]
Mr. Now respects DcfrThs and values his posts. Mr. Now wonders out loud if DcfrThs might be willing to do some detailed intermarket analysis on gold, gold shares, the indexes (SP, Dow), the dollar and the long bond. Wednesday of this week is certainly an interesting day for serious students of intermarket analysis. [/ QUOTE ] Ok so here we go: take 2. WARNING: this is long as SH*T w/ pics b/c Im going through the equity (briefly), bond (in depth) & liquidity, currency (moderate w/ pics), and gold markets (brief) Wednesday was an interesting day indeed. I dont have the tick by tick mindset though so if you are interested in that, then dont think I can be of much help [img]/images/graemlins/frown.gif[/img] Anyways, lets start where I always like to start, which is with the economy overall. Weve seen strong earnings reports, many beating estimates, and the stock market pushing ever higher with record closes. The only major drag on the economy comes from caterpillar type home construction companies & the related building folks (which, is definitely a large part of the economy). Despite that drag, business investment and consumer spending contributed to the ~2.25% real GDP increase (which puts nominal GDP at about 4.5% depending on how you calc inflation...) for the first half of 2007. the fed FOMC has further forcast growth to be above 2.5% in real terms for 2008. Given the capacity constraints well be pushing up against, even a growth rate of 1.75-2% in real terms would start to cause inflation to move towards the 2.5-3% zone, which, of course would cause a need for rate hikes. This contradicts the current yield curves current pricing. We have an inversion from ~5% on 6mo tbills down to about 4.85% on 2yr tbills. After that, it stabilizes & increases out to the 15yr mark, trading at about 5.25% (10yr was right above 5%) as of 7/19/2007. In order for this pricing to be correct, the fed must be expected to cut rates in the near-medium term (read: 6mo-2yrs). In order for that to occur, growth must slow significantly while inflation comes in. given that right now were possibly experiencing the biggest part of the slowdown in growth due to homebuilding/construction, I dont see that [fed cut scenario] as likely. So, then what could be driving the 1-2yr rate down? Well there are two main factors driving this imo: 1) the thought that housing slump will cut deep enough to warrant a cut near july of next year (based on fed funds options markets now these markets are currently more certain also as implied vol on those bets are at/near historical lows), and 2) the fear dynamic caused by deterioration in credits of the subprime based segment. Both of these drive demand up for the 2yr disproportional to the rest of the yield curve likely causing the shape we see now. Overall inflation expectations have risen a bit in the near term but remained moderate over the long term (as judged by bets on the PCE index & the BEI spread between nominal treasuries & their inflation indexed counterparts). So 2yrs I think are mispriced, as are 10yrs (which also gain from huge foreign holdings and continued buying to the tune of ~45% of total outstanding debt on that part of the curve). Id be short the 10yr now (maybe also with a steepener long/2yr, short 10yr) as well as short the 2yr outright. Aka, I bet the yield curve will shift up and steepen. Id also be going after the fed funds option market, long puts on futures at 94.75. Implied vol there is just too low (i.e. market is too certain a cut is imminent at that point of the curve). Moving onto the corporate/mortgage parts of the FI markets, we see that while the yield curve has already done a (small) upward shift, corporate debts have shifted by a proportional amount, keeping overall spreads near historical lows 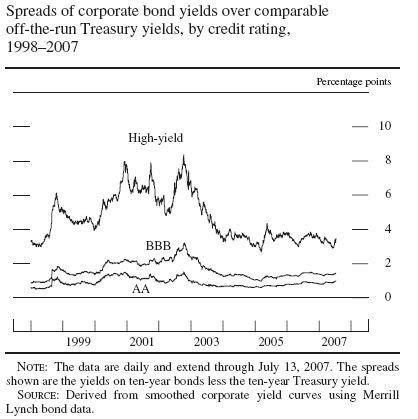 except in the subprime mortgage based section where CDS spreads have absolutely blown the F*CK out. Also, 10yr inv.grade commercial MBS over swaps spread have jumped (for crossover ratings of about BBB) but stayed low for triple A credits: 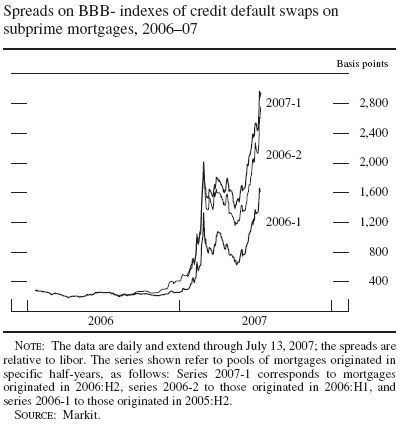 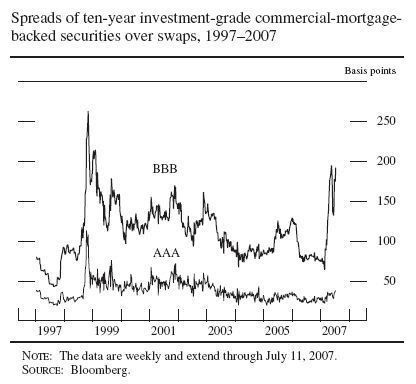 So the faith in US companies is very strong (US historical defaults for 2007 are near 0, and are expected to remain there for the near future) still as seen both by the low spreads of corp debt over treasuries and by equity market rallies. The equity market rally and bond purchases have also helped to offset, in part (but not enough) the huge current account (CA) deficits we have accumulated. But before I go there, this is a good time to briefly discuss overall liquidity conditions globally (which have contributed to the rise in risky assets in aforementioned markets as well as gold, to be discussed later). Since yields have stayed low while economy has grown, business investment and all, overall global liquidity is very high with only a small (relative) pull back in subprime credit quality. US money supply (M1 & M2, which account for demand deposits and all sorts of cash type measures) has stabilized & grown respectively. NOTE: these are not good to trade off of but important to note: 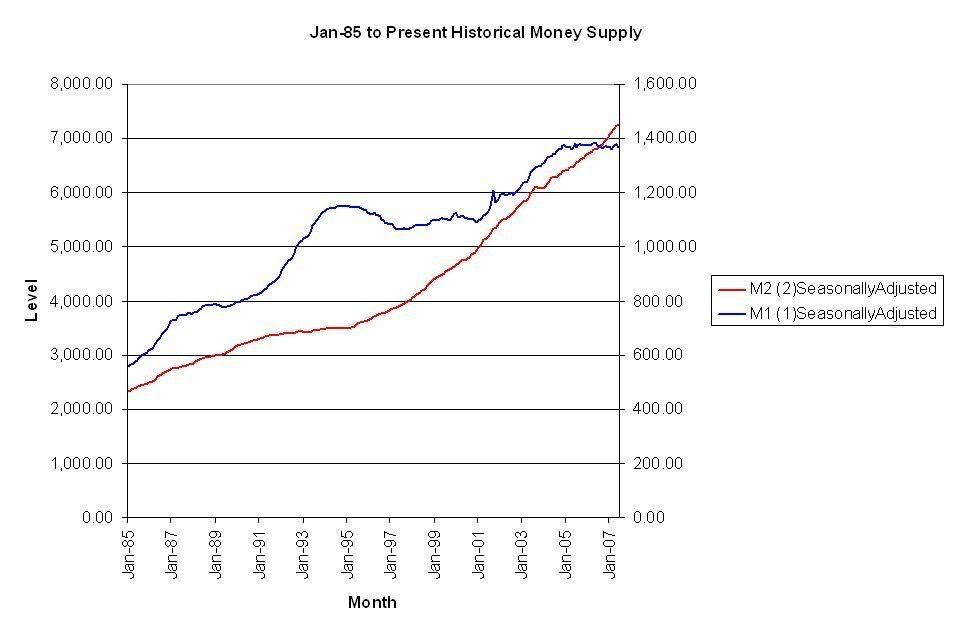 source: me & excel w/ fed data. So risky asset prices are very positively affected by this ample liquidity (including gold) Back to the CA deficits. We are near 5.75% of GDP in the hole to intl countries. The capital account (KA) has shows remarkable strength with foreigners willing to continue to purchase our debts and drive money into our markets. 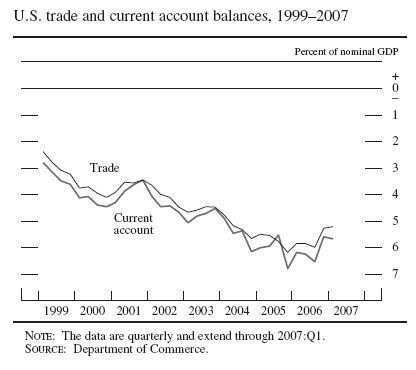  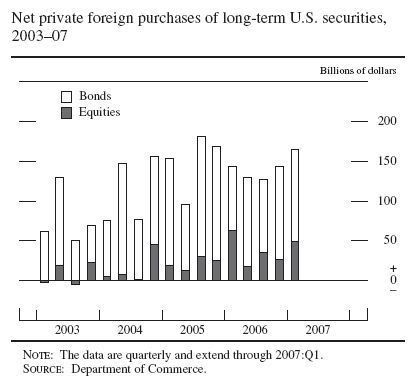 As noted though, the CA deficit is too big for the KA to finance so the currency has dropped against most of our trading partners to at or near record low levels (except of course Japan). Note that official bond purchases is basically east asian countries buying 10yr bonds, namely china. So the USD is at record lows vs. EUR & super weak vs. the GBP. JPYvs.USD though is weak (USD strong vs. JPY) as noted earlier in the thread (I recommended a purchase of JPY at 123.18 and even now at 122 and change Id be bullish). These trends are nicely pictured here: 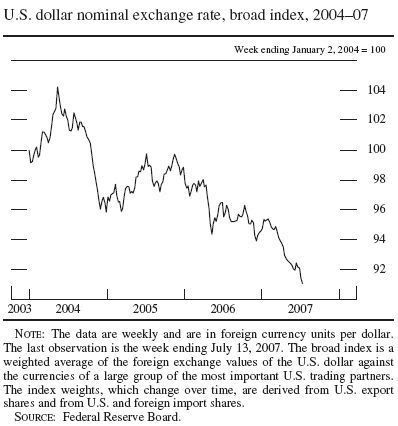 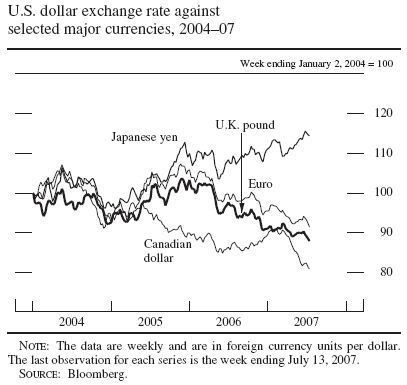 So now, that brings us to the point of this post: the gold market. Gold, historically has been treated as an inflation hedge, a store of value, a dollar hedge (more correctly, since the gold price is quoted in dollars, wed expect to see an increase in the price of gold as the dollar weakens historically that has been a 30% negative correlation which makes sense and Id expect to be even higher going forward though when it is traded off of is a different story), and most recently an allocation in portfolios by commodity seeking folks. This last part has contributed to the popularity of gold ETFs. So demand is strong for gold and supply is basically unchanging (though maybe slightly, though not significantly positively in the future years). It is said (by the FT) that all the gold in the world can be melted down and fit into an industrial (large) container. So basically, liquidity & weak dollar have likely contributed to the run up of gold prices in the very recent past. The weak dollar has been pushed down further recently by the low expectation of rates and bad CA situation not offset enough by inflows via the KA. Gold has thus likely responded to the weak dollar more strongly than high liquidity (since that is fairly constantly known and experienced as high). Another aspect, which I have to respect, despite not believing, is the technical research & trading that goes on within commodity markets. Gold has runup huge though and I think there is room to move down once liquidity comes in and it becomes more important to markets. Unfortunately for me, there seem to be a support level judged by the moving average futures price of nearby comex gold at right around 6.46-6.a48 (2nd chart). NOTICE though, that a strict reading of those support levels would put it at around 656, rather than 646-648 where it appears to be. this goes to show that while support levels can exist for one reason or another, they can also go to hell (as in the treasury bond market where 5% was the level and it broke through to 5.3%... a big difference)   So while I am losing this bet right now (gold ETF at 64.22), and it looks more likely that Ill, uh, not win it, I still hold the view that liquidity will come in and drive the price down despite technical support levels. So THAT is it this is good that I lost the first post since I have came back and BOOM made a much more important post for my own summarized learning and feel better about it than I did the first one. Hope this helps, please feel free to shower me w/ questions and break my thoughts apart. Thanks, Barron
|
|
#40
07-20-2007, 03:04 PM
|
|||
|
|||
|
some other thoughts/trade ideas:
1) latvia: read in the economist that they have a pegged currency to the EURO, huge growth, 8% inflation (up from whatever it previously was though), and a 21% of GDP CA deficit financed almost entirely by private bank loans (which are obviously used for consumption rather than investment). this is EXACTLY what i'd look for in attacking the currency. economy is moving too fast so they can't raise rates to cool it down. while "hot money" isn't moving in, there are flows that can reverse quickly and a massive trade deficit. no real investment in the economy and high inflation. that spells devaluation in the future, so i'd look for them to move off the peg. HOWEVER, i don't have all the info and i'd liek to research further via world bank & IMF site reports/studies on the economy there before going in guns blazing. it seems though that it is a candidate for the typical "consumption financed growth spurt pegged currency" dynamic leading to a devaluation. so im looking to short LATvsEUR [img]/images/graemlins/smile.gif[/img] 2) something interesting that you see over time is that, for some reason, decades seem to be good markers of economic/asset price cycles. this decade has been fantastic for risky asset prices as well as massive global growth and liquidity. what will the future hold? and will the turnaround come before 2010?? i'd bet on some at least stabilization and slight downturn...but will the decade market bring somethig more drastic from 2010-2012 or so? i guess we'll have to wait and see [img]/images/graemlins/smile.gif[/img] but i wouldn't mind writing an article about that, tracking the decade by decade movements for some publication (caugh caugh WSJ/FT) so if you have contacts, lets see 'em [img]/images/graemlins/tongue.gif[/img] Barron
|
 |
|
|


 Linear Mode

