|
#18
 11-30-2007, 09:46 AM
|
|||
|
|||
|
Heres another chart. This time a forex pair (GBP/CAD) showing a transition from a long term uptrend to downtrend earlier this year.
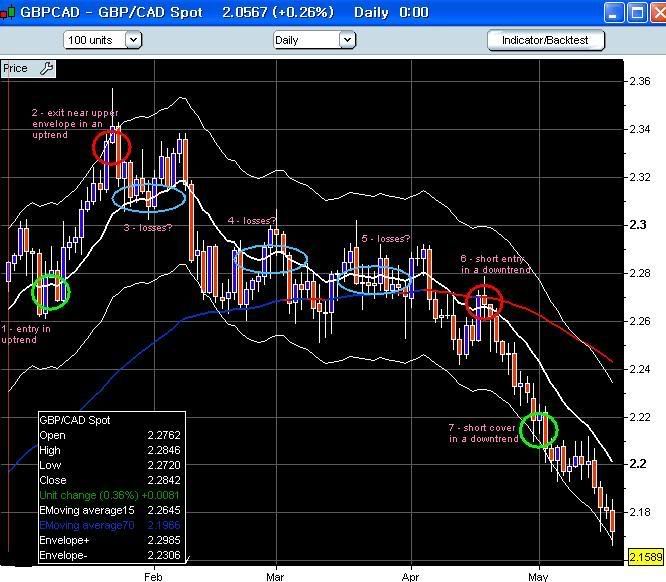 This time Ive overlaid a longer EMA (70) to illustrate the medium-term trend, which might help us to trade in the direction of least resistance. Its blue during uptrends (when the previous bars EMA value is below the most recent value) and red in downtrends. I have the same EMA15 with an envelope, but this time an envelope shift of 1.5% away from the EMA15 is enough to enclose most of the recent prices. Compare this with the 20% shift needed for the volatile mid/small cap stock (RGU) discusses in my previous post. So again, we have 2 good potential trades. Point 1 to 2 shows a similar entry/exit area as before, but then there was a change of trend which prevented us from looking for longs as the trend was down, according to the EMA70. Area 6 7 shows a good potential trade from the short side.. Notice how we would have covered our short just inside the lower envelope (around 2.26 to 2.22 a decent profit) preventing us from following the downtrend to around 2.08 a huge move lost. We may have had other opportunities to enter the trade, but this illustrates a psychologically difficult part of trading. Watching as some big fish get away is tough, but if that isnt part of your objectives or part of your trade plan, then you must be satisfied with just making a correct trade. Save following trends for another system. Points 3,4, and 5 are the tricky areas. They would probably have made us enter positions destined to be losers as they were in the middle of a transitioning trend as EMA 70 changed from up to down trending. This creates nasty, but often unavoidable, whipsaws. These losses can be limited though careful use of stops, exits, and/or applying some filters. This is a good example of the importance of getting your stops and exits right. Filters remove some opportunities to trade but hopefully leave the cream of the set-ups to trade. These can be discussed later, but a quick look at the chart suggests a few possible filters. For example, if the entire bar is below the short term trend (EMA15) during an uptrend (blueEMA70), then stand aside and vice-versa. Or another one The long-term trend needs to be a certain strength before a trade is taken. There are ways to objectively quantify the trend strength. These ideas can be discussed later but illustrate the 3 market states; up, down, sideways, and hopefully the 3 trade positions you will match to the market state; long, short, stand aside. Trying to incorporate these concepts into a simple system is difficult. 
|
|
|


 Threaded Mode