 |
|
#121
|
|||
|
|||
|
re: HR/H and HR/BIP
I'd expect these percentages to go up for most any player with Bonds skill set, for what should be obvious reasons. |
|
#122
|
|||
|
|||
|
Not sure if I should link this or not, but here you go.
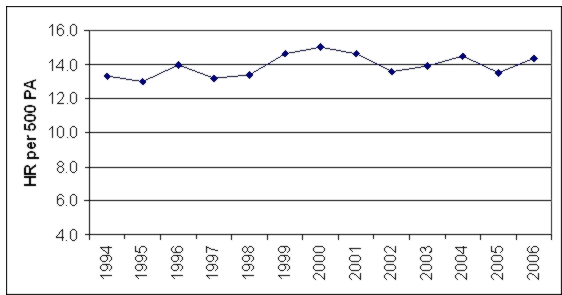
 Seems pretty steady from 1994 on. |
|
#123
|
|||
|
|||
|
WTF is that graph?
|
|
#124
|
|||
|
|||
|
[ QUOTE ]
WTF is that graph? [/ QUOTE ] Figure 3 shows the home run production rate from 1994 through 2006. The rate has held fairly steady through the period and, contrary to pronouncements by the commissioner, the production rate has not dropped in the years since Major League Baseball instituted its drug testing policy. This is clearly shown by Figure 3 as the rate has held steady since 2001, slowly undulating around the 14.0 per 500 plate appearance line. |
|
#125
|
|||
|
|||
|
[ QUOTE ]
The thing is you have not answered it. A correct answer to this question would be in the form of a number. Maybe like this: 12%, 78%, 0.4323432%, 99.23432897%. Or something similar. [/ QUOTE ] I answered the question way back in my thrid post in this thread: "I don't think he took any steroids/HGH that were illegal by law or that were banned under the MLB steroid policy." Sorry if I didn't answer it to your liking in numerical form. |
|
#126
|
|||
|
|||
|
[ QUOTE ]
Question for RedBean, If steroids were illegal from 96-02, doesn't that imply that they were against the rules? [/ QUOTE ] Except that not all steroids were illegal. |
|
#127
|
|||
|
|||
|
[ QUOTE ]
Is it just random that his 3 best years happen to coincide with the time table for his supected steroid use? [/ QUOTE ] 2 of those 3 years were after the MLB Steroid Policy took effect, and he tested clean while the overall usage among other players (ie..pitchers) went down dramatically. |
|
#128
|
|||
|
|||
|
[ QUOTE ]
However, while his home run rates did increase at the same time as league rates did, he was also doing it at an age when you would expect him to be declining. [/ QUOTE ] What age do you expect elite baseball to decline? |
|
#129
|
|||
|
|||
|
[ QUOTE ]
[ QUOTE ] Question for RedBean, If steroids were illegal from 96-02, doesn't that imply that they were against the rules? [/ QUOTE ] Except that not all steroids were illegal. [/ QUOTE ] Ahh, yes. The intellectual dishonesty returns |
|
#130
|
|||
|
|||
|
[ QUOTE ]
Not sure if I should link this or not, but here you go.  Seems pretty steady from 1994 on. [/ QUOTE ] Of course it can be misrepresented as steady when the graph is completely out of scale (ranging from 4.0 to 16.0), yet the difference between 13.5 and 14.0 huge, being nearly 200 homeruns. The same graph can be re-plotted on a scale of 12.0 to 15.0 with 0.5 increments and sold as "huge fluctuations" from year to year. Classic misrepresentation of statistics using an exaggerated scale and questionable methodology. Sweet.. |
 |
|
|