|
#652
 04-03-2007, 03:58 PM
|
|||
|
|||
|
If the pokersitescout person reads this, please add Betfair to your site.

|
|
#653
04-03-2007, 07:56 PM
|
|||
|
|||
|
so over the last 5-6 months or so the sum of traffic is only +- 3000?
|
|
#654
04-04-2007, 05:20 AM
|
|||
|
|||
|
[ QUOTE ]
so over the last 5-6 months or so the sum of traffic is only +- 3000? [/ QUOTE ] I think avg poker site peak traffic is up around 10K from the week before UIGEA.
|
|
#655
04-06-2007, 05:21 AM
|
|||
|
|||
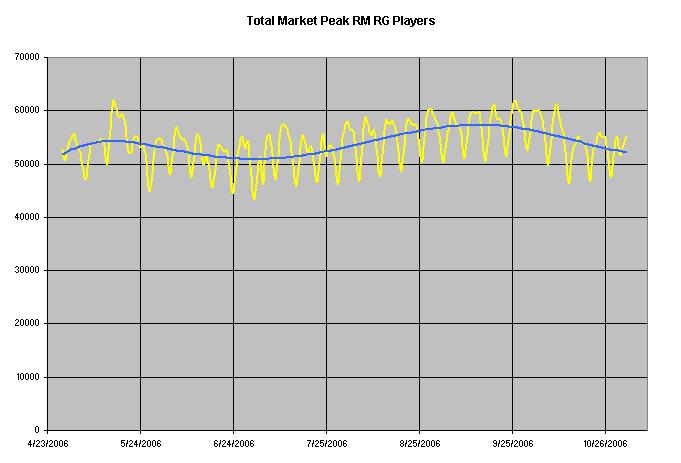
 Raw data sourced from PokerSiteScout , with permission. Daily data represents the 24 hour peak Active Real Money Ring Game seats, at each site/network. Sept Peak represents the max peak at each site across the entire month of September. 1wk Change: Day of Week difference from last week (ie Sat vs Sat last week) for last listed day 25wk Change: Day of week difference compared to the week before the legislation was signed (10/13) Color Coding: <font color="green">Green</font>(+) and <font color="red">Red</font>(-) represents increase or decrease from previous day <font color="#666666">Grey</font> = Data not available, last weeks data used 7 day avg: Avg of last 7 day's peaks. Sites sorted by 7 day avg. <font color="blue">Blue</font> = 7 Day Avg > Sept Peak.
|
|
#657
04-06-2007, 05:53 AM
|
|||
|
|||
|
This graph represents the 7 day average of Peaks across the month of March (only), for each site. I've stretched out the bottom part of the graph (again) to provide some separation...
 
|
|
#659
04-11-2007, 03:28 AM
|
|||
|
|||
|
PartyGaming 2006 Annual Report
Worth noting that Pokersitescout is mentioned in the annual report. April updates coming soon... Nat, can we get updated MTT data?
|
|
#660
04-12-2007, 03:51 PM
|
|||
|
|||
|
|
 |
|
|


 Linear Mode

