|
#1
 10-24-2007, 12:10 AM
|
|||
|
|||
|
I found this chart amongst the spam in my inbox:
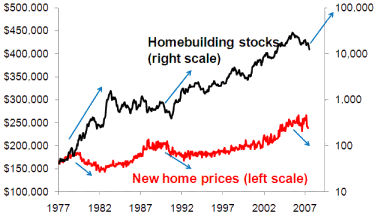 Which shows that homebuilder stocks have historically rose just after new home prices start to fall (blue arrows). From 1979-1982 and 1989-1992 new home prices dropped, yet around this time, homebuilder stocks also rose around 5-fold and 10-fold respectively (log-scale). Obviously, that guarantees nothing about the future, but it provides a potential trade set-up. Real estate investors are probably just as fearful now as they were in those 2 periods in recent history, and so people may well avoid real estate shares too. I think all this provides a good set-up for a long-term trade. I've never followed any homebuilder stocks in The US, but there's a homebuilder ETF: 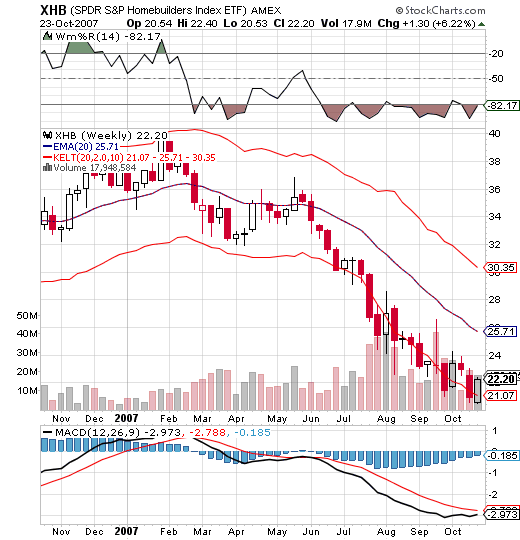 The market is oversold (looking at the oscillator), but still in a strong downtrend and so while there's a set-up, I can't see an entry as of yet. I like to use my own EMA trading channels in MS Excel, but I've used keltner channels on this chart as they're not on Stockcharts.com. This stock is currently only suitable for shorter-term shorting (IMO) and when it crosses the EMA, there's an opportunity for a short with a cover at the lower channel line. The last such opportunity appears to have been at around $35 with a target of around $30-31 from May-June. As for longer-term, I'm looking for a bullish divergence on the MACD histogram (when the market makes a lower low, but the blue histogram makes a higher low), with a possible break-out (currently above $32) or maybe a moving buy-order just above the EMA (or more conservatively, a straight buy order at the upper channel) with a stop just below the recent low, or as a factor of the market's average true range (ATR) - 5 may be provide enough room, but with corresponding higher risk and thus limitation on position size. Several entries and stop-outs may well occur before a possible big move, but keeping the position small should help contain risk. If you risk $5 per share, then risking 2% of account would be the max (2% of account size/$5 = #shares can afford). I'd use a trailing stop on this (should the trade suitably advance above the entry point) as a factor of the market's ATR but I haven't decided on a suitable value as yet (maybe ATR x 5???) for a long-term trade. Once the stock advances 50% higher than the distance between the entry and initial stop point, there could be an opportunity to pyramid into the position (eg-add X% more shares while paying attention to maintain position risk below 2% after using a sensibly-placed new stop-order). The shorter-term and longer-term basic strategies above are also a reasonable way to hedge yor positions since one tends to fade the signals of the other within different timeframes. Using both strategies simultaneously might be best on different markets within the same sector. This isn't the way I usually trade for longer-term (I use a simple breakout and a modified RSI I've created), it's just an idea (potentially muddled and fatally flawed). Anyway, posting helps my thought-processes. So... if anyone has any ideas or suggestions, please share them. 
|
|
|


 Threaded Mode