Hey guys,
My HUD is rather different than most of the ones i have seen (see below).
I like to have the numbers as big as i can possibly get them (limited by space of course). I find it is much easier on my eyes if i am playing a long session.
Also, i play on a 17" flatscreen crt monitor set to 1920X1200 resolution (thus things are somewhat small but i can fit 4+ tables without overlap). This resolution setting is also why i like the larger stats.
Finally, I generally play 5-10 tables at a time.
--------------------------------------------
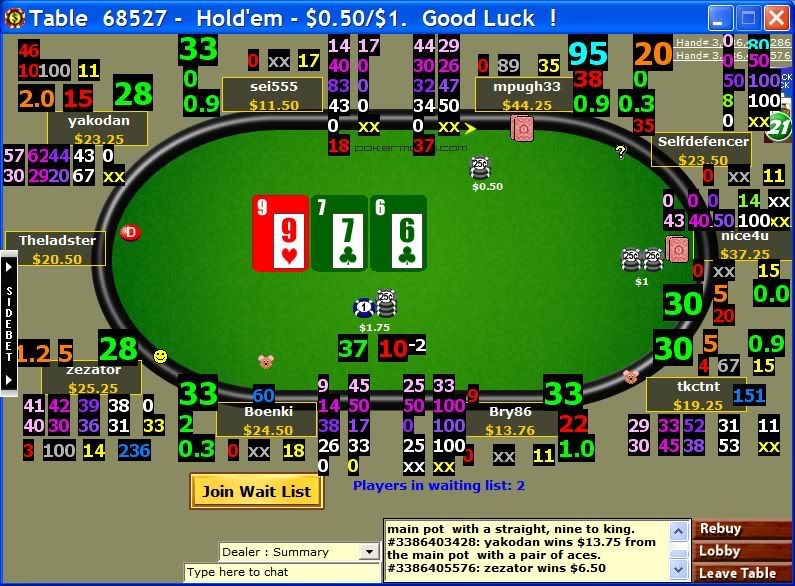
I am a very visual person and i have have colour-coded my displays so i can quickly get a sense of the player.
Also the colour coding brings my attention to particularly bad aspects of opponent's play (e.g., highlighting players with very high wtsd numbers in light blue).
I find the icons unnecessary these days with all these stats and colour coding at my disposal.
This is my basic colour coding scheme:
<font color="#00FFFF">
light blue </font>=very good for me (very bad play...eg. vp$p>42 , w$sd<22 , ... )
<font color="green">
green </font>.......=good for me (bad play)
<font color="#FF8C00">
orange </font>....=medium strength play
<font color="red">
red </font>...........=heads up be wary (#hands on player<50 , prf%>9 , ...)
I also use <font color="yellow">
yellow </font> for "weaker" plays such as calling pf bets and fold to bb steal.
The following are the stats i use (grouped):
I have grouped the standard three stats together and display them in the largest point-type. All three stats are each colour coded with a range of colours (listed above).
Vol put in pot% - Largest font (22pt)
Pfr% ------------ Large font (16pt)
Total agression - Large font (16pt)
---all other stats except these three are 13pt---
The following are layed out in pairs and each appear as one specific colour unless they are exceptionally high/low and then are displayed in another (<font color="#00FFFF">
highlight</font>/ <font color="red">
warning</font>) colour:
-Aggression frequ-(by street)- <font color="pink">
FLOP </font> - <font color="#CC00FF">
TURN </font> - <font color="purple">
RIVER </font>
-Fold to bet-(by street)------ <font color="pink">
FLOP </font> - <font color="#CC00FF">
TURN </font> - <font color="purple">
RIVER </font> --- but <font color="#00FFFF">
if >65 </font> and <font color="green">
if <40 </font>
(the above purples change from lightest on the flop to darkest on the river)
went to showdown % - <font color="green">
if<20 </font> but <font color="#00FFFF">
if>50 </font>
won at showdown% - <font color="#00FFFF">
if<22 </font> but <font color="green">
if 22 to 30 </font>
-attempt to steal bb
-<font color="yellow">
fold bb to steal </font>
finally, i grouped the last three together in the following order:
<font color="red">
check raise% </font>
<font color="#666666">
continuation bet flop% </font>
<font color="yellow">
call preflop raise% </font>
Last is the <font color="blue"> number of hands on a player </font> BUT shows as <font color="red">
red until >50 </font>
It doesn't appear on that layout but i also display some of my own stats:
- my own number of hands played at the table
- my vp$p% and pfr% at that table (to help keep a handle on my "table image")
I hope that was at least somewhat clear.
Cheers,
sean
ps.
Some stats take a long time to converge and should be used haltingly until you have a larger number of hands....things like w$sd (or bb/100).