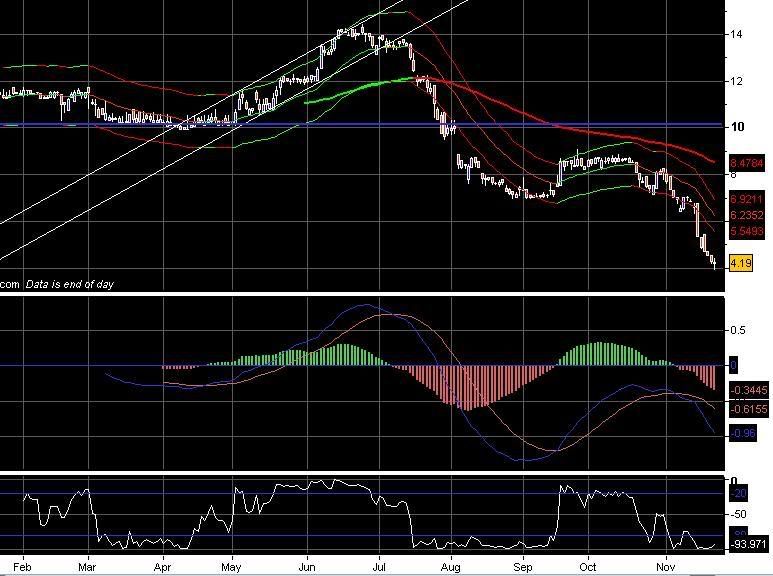
Cliffís notes: Buy at $12, sell at $9.50 and wait for confirmation before buying back in (assuming the fundamentals favour such a position)
I think TA is perhaps of limited value for analysing a thinly traded market which has only existed for a few months, but I thought I'd post some thoughts and ideas anyway. Iíll post a list of opportunities to exit along with a future opportunity to re-enter the position should the OPís fundamental analysis of the company still provide a set-up to begin accumulating stock again.

The stock seems to have found its first support just above $10 (blue line) and entered a rather weak/shallow cup with handle pattern at the beginning of March. There is a weak handle at the beginning of May, followed by a breakout on 21st May. Longs can be entered on this day around the $12 mark (I know itís thinly traded, and Iím not sure what the OPís position size was and whether it contributed to the uptrend during May/June)I believe the OP scaled in his purchases somewhere within the uptrending channel (during May-June). A sensible stop-loss could be below the initial support (ie-below $10) or as a function of ATR. A 15-day smoothed ATR on 21st May was around $0.50. This is a volatile market and wide stops would probably be needed. 6xATR would provide plenty of room to whether noise, but leave us exposed to high initial risk.
Break of support stop ~ $10
6 x ATR stop ~ $9
So, placing a stop around $9.50 would leave us exposed to $2.50 initial risk assuming we got in at $12. This equates to a 20% drop in price Ė quite a wide stop. Getting out at that price might obviously prove to be a headache in a thinly traded market. If we have a $100K account, then risking 5% of that would probably be too much, but not desperately unreasonable for a concentrated portfolio. 5% of 100K would be $5000. $5000/$2.5 = 2000. So, buying 2000 shares of DSUP for each $100K account size of would expose us to 5% initial risk. This would equate to an initial position size of $24000 (assuming $12 entry with a $100K account).
Looking back at the chart, we see EMA22 and EMA 110 (1 month & 6 months respectively) turn bearish around mid-July. EMA22 is enveloped by an 11% shift which contains most of the marketís prices up to that point. (11% is very wide /volatile). Even this 11% envelope is unable to contain the 6%+ break on and continuing after 25th July. The stock then spends about 1 week around the support created during March/April and touches our $9.50 stop on 30th July.
On 30th July and onwards is when the position should be dumped/scaled out of . On 7th August the stock gaps down and closes over 15% in the red. There is more temporary support around $7 before the market jumps into temporary resistance around $9 and fails to test the support of $10 created several months prior. The market then breaks this new support in the second week of November and goes into free-fall.
Looking for another entry:
If you look at the negative MACD histogram and the low prices, you can see that the histogram low created around the 10th August is lower than the current value even though current prices are lower now than they were during the previous MACD-h low. This suggests a bullish divergence is brewing. This is one of the strongest signal in technical analysis and suggests the bears are running out of steam and selling pressure is subsiding. If the new negative MACD-h traces a higher low while the market traces a lower low, then there's a bullish divergence. Wait for the stock to tick up and for the slope of EMA22 to point upwards. Further confirmation would be EMA 110 turning upwards but this will be severely lagging after a strong bear move.
Once (or if) an upward move is confirmed, then another position could be built using the suggestions above with regards to initial risk and position sizing. A stop can be placed under resistance, as a function of ATR, or below the recent low.
I canít see an entry at the right edge of the chart, but you need to watch for possible confirmation in the future. Should an upmove be confirmed and a large position needs to be built, then we can use the oscillator (Williams %R) to scale in. Buying the dips during an uptrend (ie - when EMA110 is pointing upwards, but Williams %R is below 80 and rising) allow us to buy value, and perhaps with reduced slippage.