|
|
|
#1
 09-07-2007, 11:57 AM
|
|||
|
|||
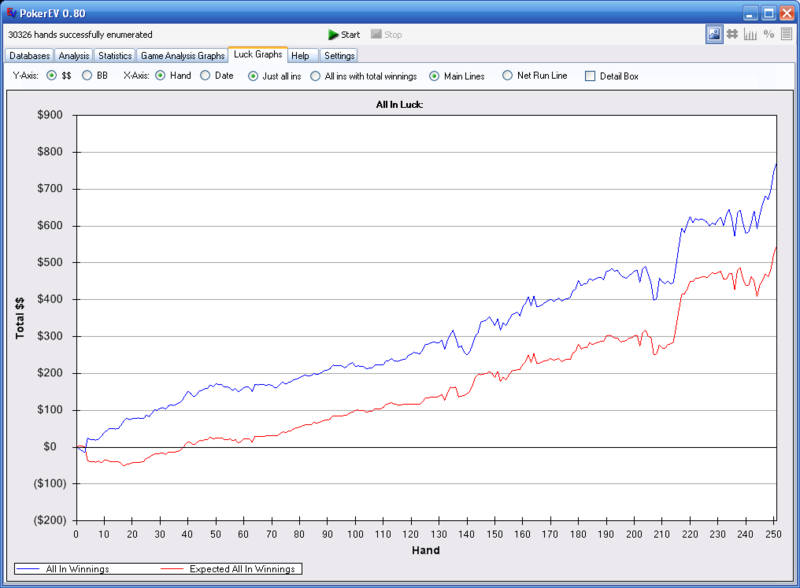  i understand the luck graph mean i'm a luckbox... but can anything be learned from the other graph? 
|
|
#2
09-07-2007, 12:06 PM
|
|||
|
|||
|
Yeah, the first one shows expectation versus actuall winnings in pots where all the money went in before the river. Its an indication of wether or not you're running good/bad. You've run very good lately! My red one is still 20 % below the blue one after 300 all-in pots >_<
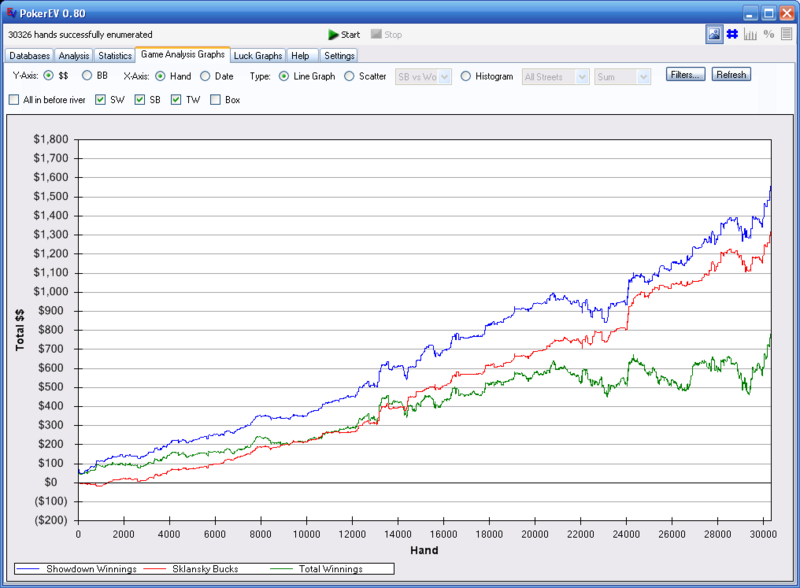
The other one shows: Blue line - Your showdown winnings. Red line - Expected showdown winnings. When the blue line is above the red line it means you've been lucky in all-in situations, winning more than expected. The green one is overall winnings. This one is lower than the two others because you lose money by folding before showdown. This is normal BTW. I cant remember seeing any graphs where somebody came out positive in pots that ended before showdown.
|
|
#3
09-07-2007, 12:49 PM
|
|||
|
|||
|
[ QUOTE ]
I cant remember seeing any graphs where somebody came out positive in pots that ended before showdown. [/ QUOTE ] I'm surprised at this, because that's almost the definition of playing good poker. Your steals should show a profit. Your cbets should show a profit. Your bluffs should show a profit. If they don't, why do them? Shania?
|
|
#4
09-07-2007, 12:55 PM
|
|||
|
|||
|
The fact that your green line is low means that you should look at hands where you didn't go to showdown. It doesn't necessarily mean you are playing them wrong, but it means you may be losing money here (or not making as much as you can).
|
|
#5
09-07-2007, 01:26 PM
|
|||
|
|||
|
[ QUOTE ]
[ QUOTE ] I cant remember seeing any graphs where somebody came out positive in pots that ended before showdown. [/ QUOTE ] I'm surprised at this, because that's almost the definition of playing good poker. Your steals should show a profit. Your cbets should show a profit. Your bluffs should show a profit. If they don't, why do them? Shania? [/ QUOTE ] True, but it isn't just c-bets and bluffs that are reflected in the green line. Also factored in are things like money you lose to blinds, chasing draws w/ good odds but then the draw doesn't hit, and things like that. It's very common for actual winnings to be below showdown winnings for these reasons, although i have seen graphs where the lines are all about equal and a couple where the green does exceed the others.
|
|
#6
09-07-2007, 01:33 PM
|
|||
|
|||
|
Also, keep in mind that the PokerEV all-in graph doesn't really provide a complete picture of how you are running, because it doesn't factor in cooler situations.
For example, say you are dealt KK preflop five times, and each time you end up going all-in preflop. Each time you are up against AA. Let's say you lose four times and win one of those times. According to the all-in graph, you would be running pretty much as expected. But considering the fact that each time you were dealt kings you were up against aces, most people would consider this running pretty badly. However, this wouldn't show up in the graph. This type of situational "running bad" is not reflected in PokerEV. I remember once I had a set lose to a higher set three times within about 1000 hands. Now this is pretty awful luck if you ask me, but according to PokerEV I was running neutral.
|
|
#7
09-07-2007, 01:54 PM
|
|||
|
|||
|
[ QUOTE ]
although i have seen graphs where the lines are all about equal and a couple where the green does exceed the others. [/ QUOTE ] Got an example of say 20k+ hands? I'd need a winrate of 21 bb/100 to bring the green line up to the blue line..
|
|
#8
09-07-2007, 03:05 PM
|
|||
|
|||
|
[ QUOTE ]
[ QUOTE ] although i have seen graphs where the lines are all about equal and a couple where the green does exceed the others. [/ QUOTE ] Got an example of say 20k+ hands? I'd need a winrate of 21 bb/100 to bring the green line up to the blue line.. [/ QUOTE ] Check out this thread
|
|
#9
09-07-2007, 03:22 PM
|
|||
|
|||
|
[ QUOTE ]
[ QUOTE ] although i have seen graphs where the lines are all about equal and a couple where the green does exceed the others. [/ QUOTE ] Got an example of say 20k+ hands? I'd need a winrate of 21 bb/100 to bring the green line up to the blue line.. [/ QUOTE ] I got one. My green graph is way higher than the other ones [img]/images/graemlins/wink.gif[/img].  
|
|
#10
09-14-2007, 02:08 PM
|
|||
|
|||
|
[ QUOTE ]
[ QUOTE ] although i have seen graphs where the lines are all about equal and a couple where the green does exceed the others. [/ QUOTE ] Got an example of say 20k+ hands? I'd need a winrate of 21 bb/100 to bring the green line up to the blue line.. [/ QUOTE ] Yeah, I've got one as well. It seems to be the norm though for the green line to be below the red/blue line in the micro/small stakes games - which makes total sense, because you have to show down a winner in these games, so there isnt any chance to pick up a lot of pots by stealing. And the inverse is also true. When you're playing against tighter, thinking opponents, who are willing to laydown hands (i.e. the solid players who populate the mid-high stakes), then you're going to make the majority of your money by winning pots that don't go to showdown. By definition, if you get all-in/to a showdown against a solid player, you likely won't have the best of it. If there's one thing I've learned from all these analyses, it's that the ability to adjust is the most important part of winning at online poker at the moment. While I think that some of the pro's at certain limits are very talented, thinking individuals, I suspect the majority of them probably just lucked into the right strategy to beat their limit. I.e., being a total (thinking) LAGtard will beat up the TAGs at the higher limits, and at the lower limits being a nitty TAG will rake in the money, and everything in between. Always adjust to your table. Finally, here's two graphs, one from 200NL ring and the other from 400NL 6max. Same player (me), one with the oh-so-elusive green line on top, the other with the green line on bottom. 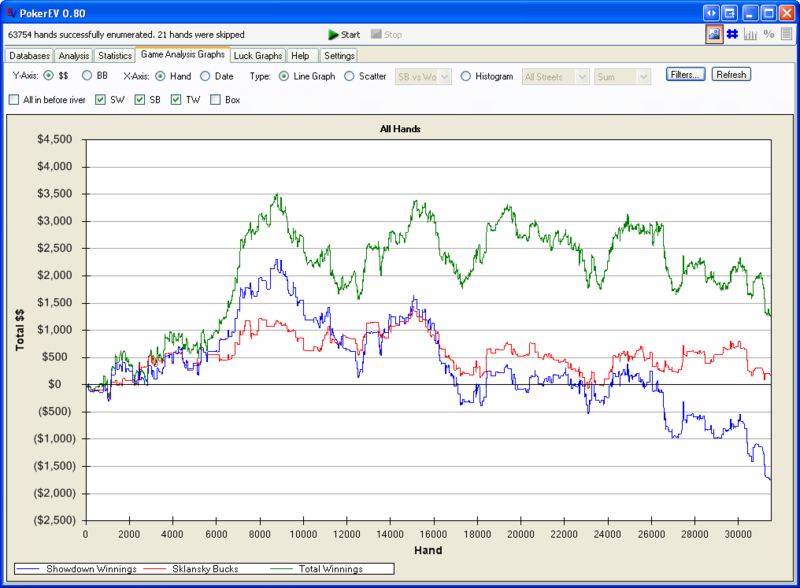 
|
 |
|
|


 Hybrid Mode
